Website Statistics

Understanding Your Website Statistics

Once you have built and launched your website, you can start to learn more about the traffic you receive to it.

You may have heard the terms "website analytics" and "website statistics." But what exactly do they mean and why are they useful to your website.

In this article, we will look at what website statistics are, where to get them, and most importantly, what can you do with them. We will also take a look at Google Analytics for your website.

Understanding Your Website Statistics

What is website analytics?

In the simplest terms, website analytics is the study of your website visitors:
  • Where are they located (their geographical location)
  • Which browser are they using
  • How they got to your website
  • What keywords they used to get to your website
  • What pages did they look at
  • How long did they spend on your website
  • Did any of them turn into customers
  • Where did they exit
  • How often do they come back
Understanding Your Website Statistics

Can't I just use a hit counter?

A hit counter typically measures the number of times a page has been viewed. The advantage of hit counters is that many are free and can be customized to fit in with the feel of your website.

Problems with using a hit counter

But hit counters have major drawbacks:

  1. They don't tell you any information about your visitors, ie. where they are located and how much time they spent on your website.
  2. They don't tell you the time period – hit counters displays the accumulated views since the installation of the counter, so it is almost impossible for you to keep track of when traffic increases or drops.
  3. They are often packaged with spyware, ad-ware, pop-ups and banners – spammers can embed links into the counter's image, linking the counter to spamming websites. All hosting services and website builders have policies against spyware and ad-ware that could result in the removal of your website.
  4. If the hit counter has an embedded link that links your website to a spamming site, it will de-value your website on search engines. You might get red-flagged or worse, banned from search engines.

Alternatives to hit counters

There are many free alternatives to hit counters that are just as easy to add to your website. Many website builders and web hosting providers include a website analytics tool as part of their plans. You can also use Google Analytics – it is free and can be easily integrated onto your website.

Where can I get a website analytics tools for my website?

Web Hosting Providers

Most web hosts and many website builders will include a website analytics tool as part of service packages. You should be able to find it in the account's control panel.

Some of the popular website analytics tools are:
  • AWStats
  • Analog
  • WebAlizer
  • Clicky

Of course, web hosts also allow you to keep track of your website's statistics by integrating Google Analytics.

Website Builders

If you are using Weebly, Squarespace or Website.com to build your website, you will find a built-in website analytics tool and dashboard on your account control panel.

Wix does not offer any built-in website analytics tool, but they do offer one-click installation for Web-Stat, a 3rd party application.

And of course, all these website builders allow you to integrate Google Analytics. Note that if you are using Wix or Weebly, you will need to upgrade to a premium/paid plan to use Google Analytics on your account – Google Analytics is not supported on the free website builder plans.

Google Analytics (free)

Google Analytics has become the standard in web analytics tools. It is the most commonly used and certainly one of the most robust and powerful analytics tools available on the market. Google Analytics is free and is widely supported by most web hosts, website builders and platforms (ie. WordPress). All you need to do is signup for a Google Analytics account and copy-and-paste the tracking URL into your web host or website builder control panel.

CrazyEgg (paid)

"Crazy Egg is like a pair of x-ray glasses that lets you see exactly what people are doing on your website." It uses heat map, scroll map and other neat tools to show you where your visitors are clicking, how many people scroll down your pages and where most people stop, where visitors come from and who clicks on what the most, and more.

Just like Google Analytics, Crazy Egg is easy to setup – all you have to do is insert the CrazyEgg tracking code into the footer of the pages you want to track. If you are using a website builder, you will need to make sure your website builder supports Custom Codes in the Page Footer section.

KISSmetrics (paid)

KISSmetrics is more suitable for e-commerce websites. Unlike Google Analytics, KISSmetrics focuses more on tracking your visitors and helping you identity and improve conversions on your online business. It keeps track of visitors returning to your website and what they do on your website when they re-visit.


Understanding information on your website statistics report

If you have just started using a website analytics tool, the amount of data you get can be overwhelming. For example, when you log into Google Analytics, you will see various charts, graphs and items.

But don't get intimidated. The key is to start with the basic data.

  1. Users and Sessions – how many people were on your website?

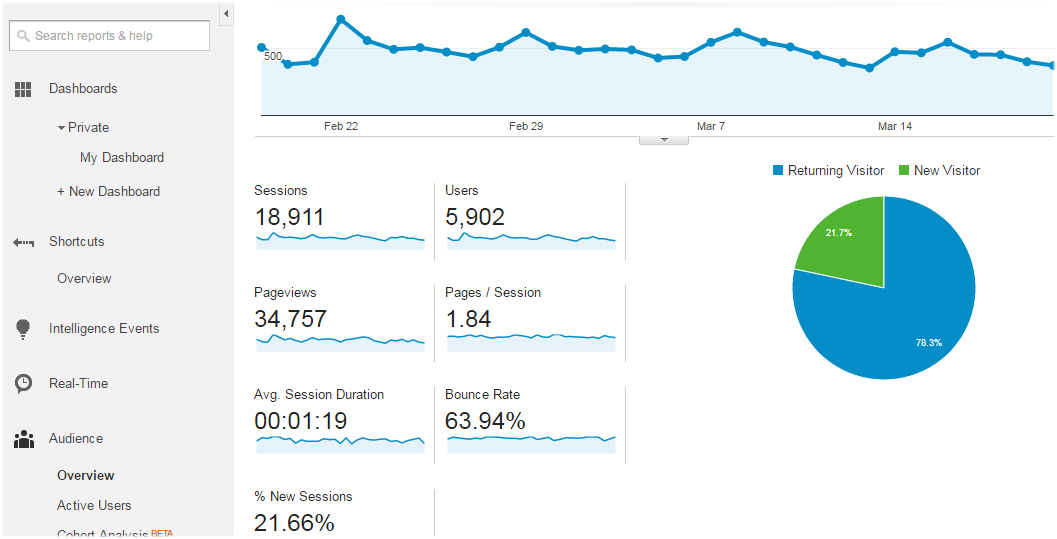
    Users is the number of visitors you have had on your website within the specified date range. This metric includes both new and returning visitors.

    A Session is "a group of interactions that take place on your website within a given time frame." Simply put, it includes everything an individual visitor does on your website within a pre-set time frame.

    Note: By default, a session ends after 30 minutes of inactivity.

    Let's look at this example. When a user, say Tom, arrives on your website, Google Analytics starts counting from that moment. In other words, his session starts. Every time Tom interacts with the website (for example, opens a new page, clicks on a button, etc.) the interaction is recorded. If 30 minutes pass without any interaction from Tom, the session ends.

    Sessions is different from Pageviews. Pageviews is the total number of pages views, including repeat views of a single page. This is where pageviews fall short – it doesn't tell you how engaged your visitors are. While it tells you how many pages are viewed, it doesn't tell you if your visitors viewed a lot of pages because of the value and quality of your content, or if it's because they couldn't find what they were looking for (ie. jumping from page to page).

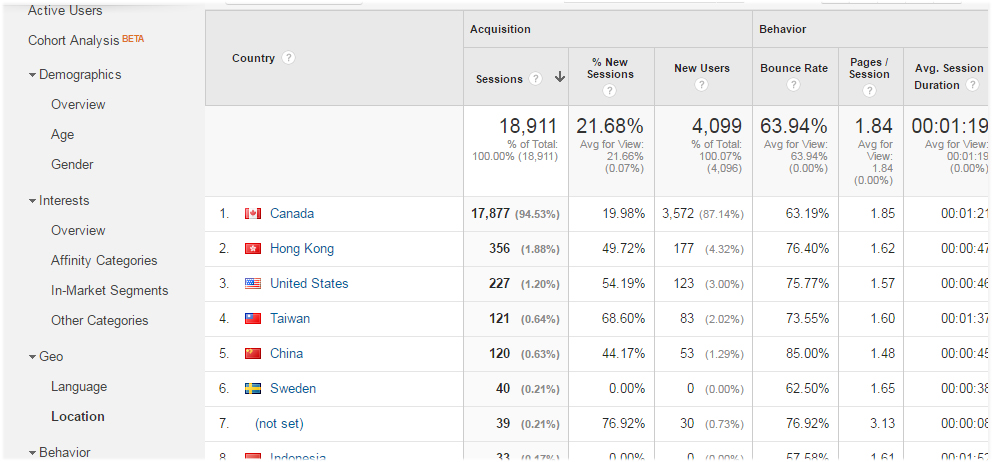
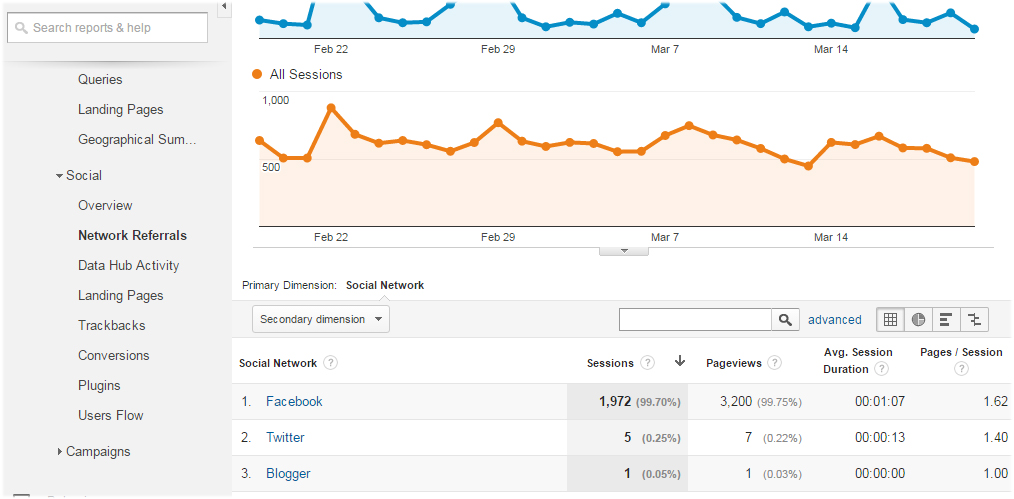
  2. Traffic Sources – How did they get here?

    Once you have gotten a better idea of how many visitors are visiting your website, your next question would be, where are these people coming from? and how did they get here?

    Traffic Sources is where you will find those answers. It shows you where your visitors are coming from.

    Every visitor comes from somewhere (or source) and the most common sources are:
    • Search traffic – these visitors arrived at your website from search engines such as Google and Bing.
    • Referral traffic – these visitors arrived at your website from other websites (ie. your banner ads, a link on Facebook or a link from another blog).
    • Direct traffic – these visitors typed your web address directly into their web browser.
    • Other – these include marketing campaigns you have run, email, etc.

    You can learn a lot by understanding where your visitors are coming from. It gives you an idea of where you should concentrate your marketing efforts, the strength of your brand, if your email campaigns are working, etc.

  3. Bounce Rate – How many people were just "passer-bys"?

    Bounce Rate is the percentage of visits in which the visitor has left your website from the entrance page, without interacting with the page. In other words, a "bounce" is when someone arrives at your website and immediately clicks on the back button or closes their web browser. This is similar to a customer walking in the front door of your store, and immediately walking back out the door.

    While it could just be as simple as a visitor arrived at your website by accident (ie. web address typo or an unintended click on the search engine results), but it could also mean the visitor didn't find what they were looking for on your website and decided to leave.

    While on its own, the bounce rate doesn't tell you much about your visitors (other than the fact that they left your website). But when you combine it with other website statistical data, you can get a better understanding of things. For example say your website gets a lot of traffic from search engines and has a high bounce rate, it means that visitors clicked on your link thinking they would find what they need on your website, but only to realized that's not the case once they have landed on your website – so it could be a strong indication that you are targeting the wrong keywords or your site title and description could use a bit fine-tuning.

  4. Exit Page – Which page did they leave from?

    Unlike a "bounce", an "exit" is when a visitor views multiple pages on your website and then leaves.

    In other words, the Exit Page data tells you the most common pages that visitors views last before leaving your website.

    Some pages naturally have a higher exit rate, such as the order receipt page or the contact form submission confirmation page – a visitor is most likely done after they see that they have successfully submitted a purchase order or inquiry.

    However, if you have high exit rates on other pages on your website, it might be an indication of problems. For example, if your View Shopping Cart page is one of the top exit pages on your website, then you might have to examine if the page is not doing its intended function – converting visitors to customers.

  5. Conversion Rate – How many of them left an impression on your website?

    Conversion rate tells you the percentage of visitors who complete a desired action on your website, such as making a purchase, signing up for email newsletters, viewing a specific page on your website.

    In other words, it measures how many visitors interacted with your website and how successful your website is. For example, if your website has a low conversion rate, you are either attracting the wrong type of visitors to your website, or your website is not effective at convincing your visitors that you have what they are looking for.

  6. Top Content/Pages – Which page(s) did they view the most?

    It is always important to know what pages on your website are getting the most traffic. For example, if you have a page that receives the majority of your website traffic, then you know that content added to that particular page would most likely be viewed by your visitors and would most likely give you the best conversion rate.

  7. Pages/Session and Average visit duration – How long did they stay on your website?

    Page per session is the average number of pages a visitor views during a session on your website.

    Average session duration is the average amount of time a visitor spends on your website within a session.

    These data can be used as an indication of how engaged a visitor is with your content and your overall website design. For example, if the Page/Session metric is high but the Avg. Session Duration metric is awfully low (say 30 seconds or less), it might be an indication that your content is not interesting enough or maybe your website's design and layout is too difficult and confusing to navigate – visitors are basically jumping from page to page without spending much time to read your content.

Why is it important to track my website statistics?

Website statistics provide you with information about your website visitors. With this information, you can fine-tune your website to enhance visitor experience and hopefully improve your website's conversion rate.

  1. Is your website sticky enough?

    When you look at the number of users on your websites, in particular the percentage of Returning visitors, you get a sense of how sticky your website is - if you have a low percentage of returning visitors, then there is a chance that your website is not sticky enough to warrant repeat traffic. You want people to come to your website and you want them to keep coming back. You may want to re-examine your content to make sure it's valuable enough for people to keep coming back for more.

  2. Are you targeting the correct keywords?

    Your website Traffic Sources report as well as Bounce Rate are good indications of how successful your SEO efforts are. For example, if only a small percentage of your website traffic comes from search engines, it might mean that you are not ranking well on the search engines. Similarly, if the majority of your traffic is coming from search engines, but your website has a exceptionally high bounce rate, you might have a problem with your keyword tactics. It might be time to re-examine your target keywords and SEO strategies.

    If your website analytics tools offers a keyword report, you can use it to find out which keywords are generating the most traffic to your website.

    Say you run a gardening hobby website and you are getting a lot of traffic to your website, but when you look at your website statistics report, you see that the majority of the traffic is coming in via the search term "recipes," " parenting issues" or other terms unrelated to your website. This is a problem because these visitors will most likely not be interested in your gardening website and will leave your website immediately.

  3. Are you reaching out to your target market?

    One of the data provided by a website statistics report is the geographical location of your visitors. If your marketing plans involve targeting a particular country, your website statistics report will tell you if your visitors are coming from that country or another. Say your online store targets North American customers but the majority of your visitors come from Europe, then you will need to fine-tune your marketing efforts to reach out to the right audiences.

    Other data that helps you optimize your website content and design include: Language (as per the language settings on your visitors' browsers) and age.

    All these demographics and geographic metrics allow you to better understand who your visitors are and helps you determine if your website is reaching out to the targeted audience and market or if you need to re-evaluate your marketing efforts, site content and design so that your website appeals to your target visitors.

  4. Are your visitors doing what you want them to do?

    Say you run an online store. Your ultimate goal is for your visitors to purchase from you. In addition to the conversion metrics, data such as exit pages can help you determine if the path to purchase on your website is working properly.

    An example of a path to purchase could be:
    Homepage > Product Page > Shopping Cart page > Shipping Confirmation page > Billing Details page > Order submission page > Payment Confirmation page

    If you notice that a lot of visitors are exiting your website at the shipping or billing pages, then you might want to go back and optimize these pages to make the path to purchase easier to follow. Not only does it provide a better shopping experience for your visitors, it also gives you a greater chance of converting the visitor to an actual paying customer.

  5. Are you putting your most important content on the right pages?

    Your Content report tells you which pages your visitors value and view the most. The time engagement metrics (ie. time spent on page) shows if your visitors are taking the time to view your content. Together, these data lets you focus on improving the content on your not-so-popular pages and at the same time helps you determine which pages are the best to use when promoting new products or display important news articles, etc.

  6. Are people recommending your website to their friends?

    When you view your Traffic Sources and Network Referral statistics, you will see the main websites and social networking sites that are sending traffic to your website.

    This helps you identify your strongest and most influential brand advocates, whether it be a Facebook or Twitter user or a blogger. This information is also extremely useful if you market your business through social media websites or through guest blogging or blog commenting on other blogs – you need to make sure your marketing efforts are paying off.

  7. Are you providing your visitors the most enjoyable viewing experience?

    While website analytics tool cannot tell you exactly if your visitors is enjoying their stay on your website, it does give you a little indication if they are not enjoying your website.

    For example, your website statistics report will show you the most popular web browsers your visitors are using. This information is important for website compatibility issues – for example, if you only use Google Chrome to build and test your website, but the majority of your visitors uses Internet Explorer or Safari, you need to make sure your website work properly in those browsers, too.

    Another example, Page/Session and the Avg. Session Duration metrics are indicators of how engaged your visitors are on your website. Like we have mentioned earlier, if the Page/Session metric is high but the Avg. Session Duration metric is awfully low (say 30 seconds or less), it might be an indication that your content is not interesting enough or maybe your website's design and layout is too difficult and confusing to navigate – visitors are basically jumping from page to page without spending much time to read your content.

    Another factor that impacts visitor experience is page loading speed. If you are using Google Analytics, you can use the Site Speed reports to find out the page loading times across your website. This allows you to identify and fix slow pages, and thus improving website performance and visitor experience.

    Also, if you are not using a mobile-friendly or responsive website design and most of your traffic is coming in from mobile devices, it's time to make the necessary changes to accommodate these mobile visitors.

Will website analytics tell me if my website is getting bad traffic?

Yes, it will. "Bad traffic" is when the traffic you are getting to your website is completely unrelated to what your website is about.

Most analytics tools will show you a list of search terms that are driving the most traffic to your website. For example, if you are using Google Analytics, you can find this information in the Search Engine Optimization report, under "Queries". This report will tell you what people have searched for on search engines to find your website and how many of your visitors came to your website using that search term.

This information is important because it allows you to fine-tune your website's keywords.

Say you run a gardening hobby website and you are getting a lot of traffic to your website, but when you look at your website statistics report, you see that the majority of the traffic is coming in via the search term "recipes," " parenting issues" or other terms unrelated to your website. This is a problem because these visitors will not be interested in your gardening website and will leave your website immediately.

With a Keyword report, you can find out if the keywords you're targeting need to be corrected or fine-tuned. You can re-examine the keywords you are using and make sure all SEO attributes (ie. title tags, image tags, site description, etc.) are correct.

You can also optimize your page for the unrelated keywords. For example, if visitors searched for "parenting issues" you can show them tips on how to use gardening as an activity to foster better parent-child relationships, etc. This would allow those visitors to become more engaged with your website and might increase their chances of browsing the other pages of your website.